To get 2024 off to a good start, new features are appearing on PRIM! Discovering our most popular data and recommending data will make it easier for you to navigate our Open Data and make it easier for you to discover the data released on PRIM. Optimizing the display of data visualizations provides better visibility of datasets.
Highlighting popular data:
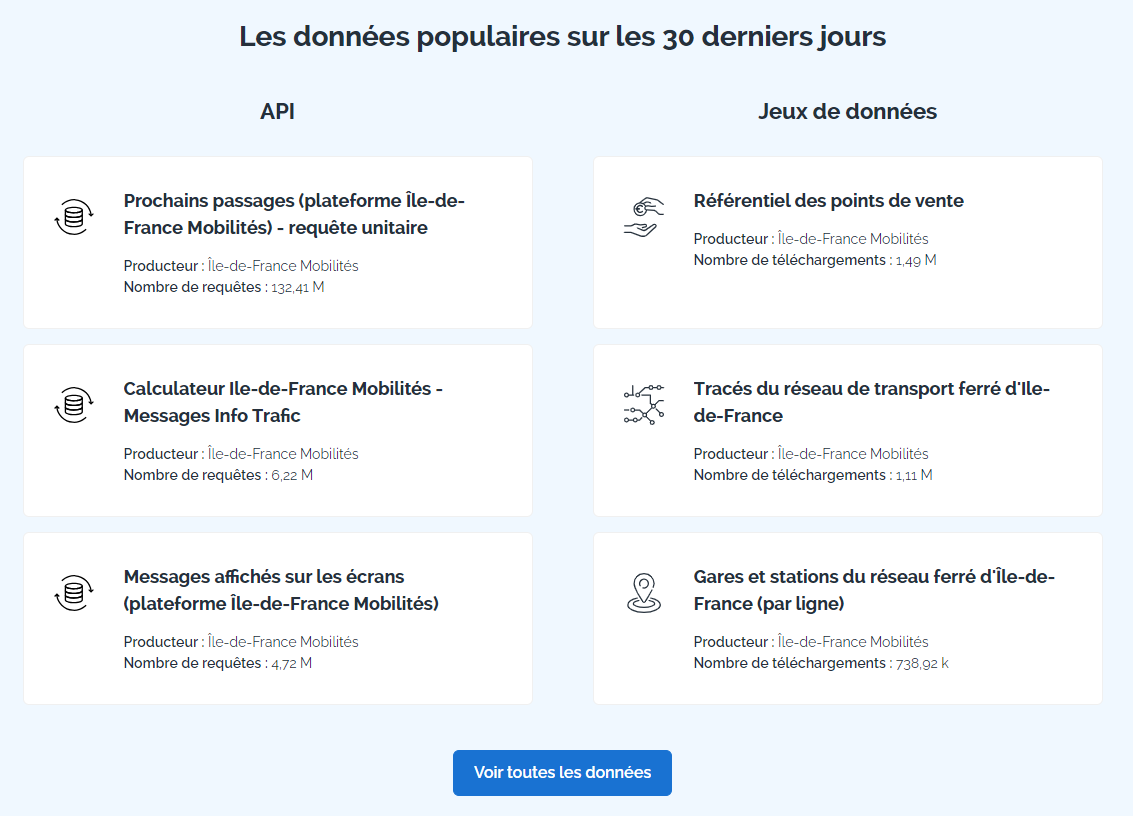
A new section is available on the home page: "Popular data over the last 30 days". This component allows you to see the top 3 most downloaded datasets and the most requested APIs of PRIM, over the last 30 days. The number of downloads and the number of requests are also shown. Clicking on the "View All Data" button will take you to the catalog sorted in order of data popularity.
Ideal for monitoring PRIM's most used data!

In addition, you will now be able to sort the data catalog according to the sorting method of your choice : alphabetically, in order of popularity, or to view only your favorite data.

Data recommendations:
When you browse the detail page of a data, you may notice the presence of a "Data recommendation" component. By clicking on "Discover other data", you will be redirected to the recommended data related to the data consulted, located at the bottom of the page. You will then be able to discover the data we recommend, sorted by category.
For example, if you are used to consulting the dataset "Scheduled schedules on public transport lines in Ile-de-France (GTFS Datahub)", you might be interested in the dataset "Routes of public transport lines in Île-de-France (source GTFS)" in connection with the GTFS category. If you are interested in the data concerning the transport offer , then the API "Calculator Ile-de-France Mobilités - Generic access" and the dataset "Repository and theoretical offer in Netex format" are also recommended.

Optimization of the display of data visualizations:
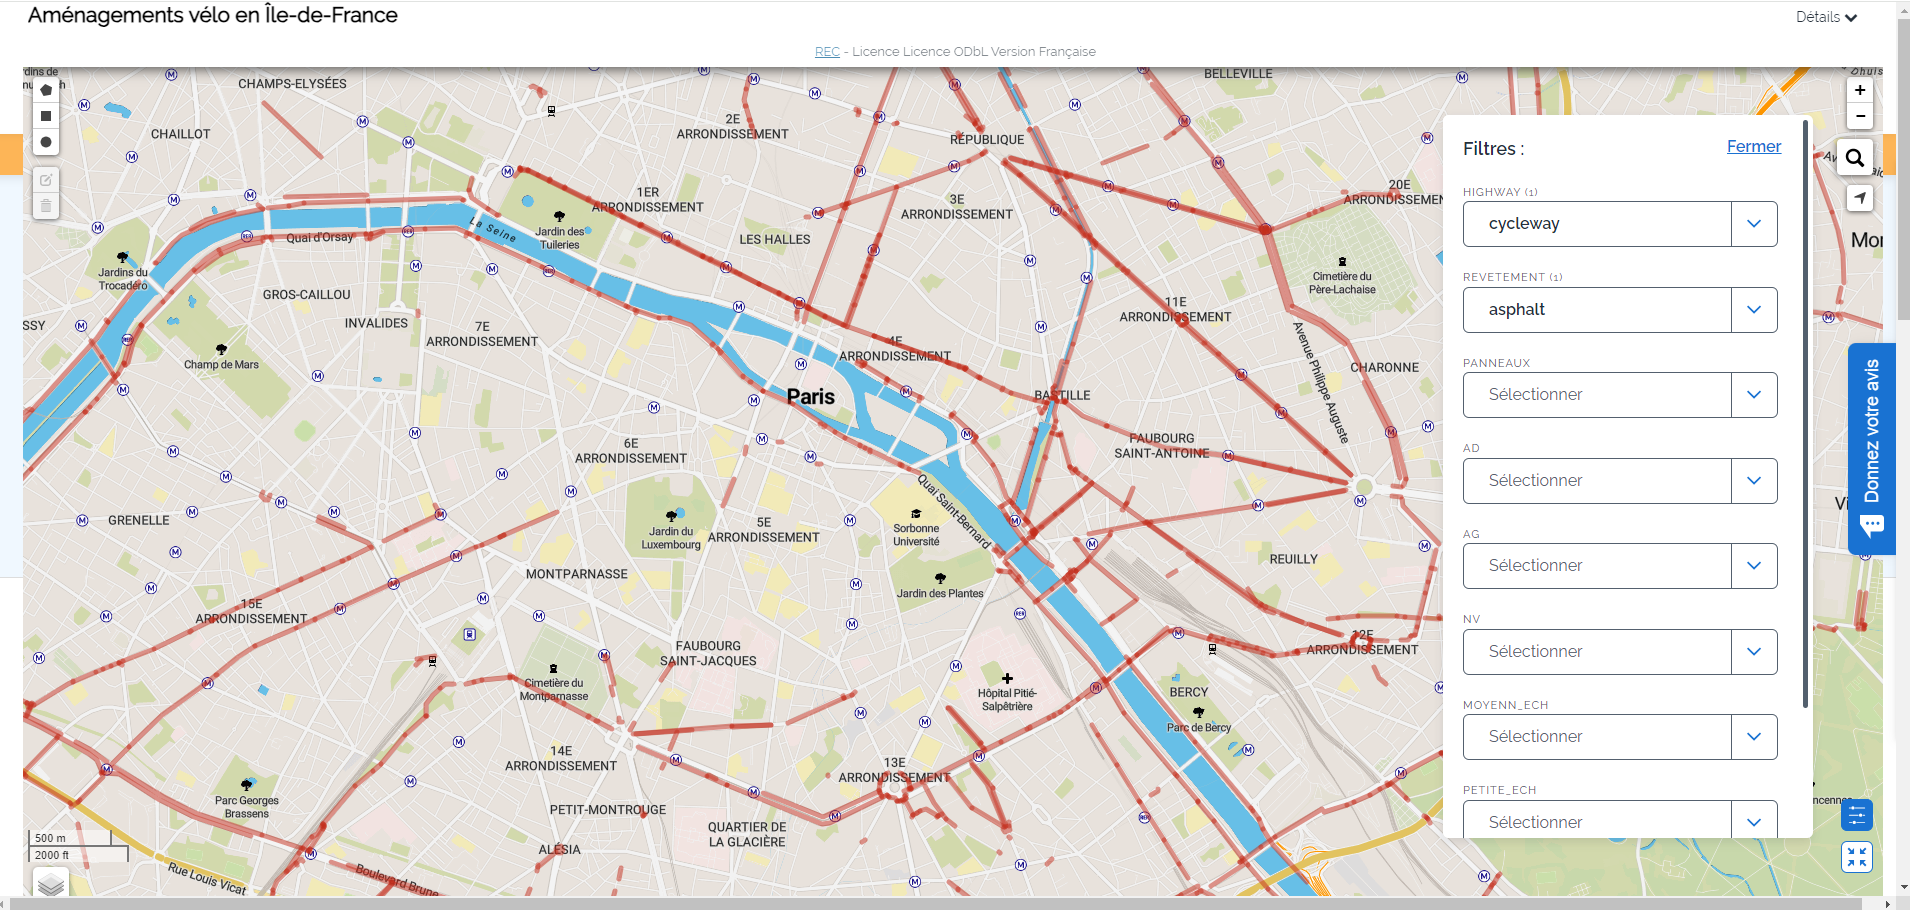
In order to allow better visibility of the data, all the data visualizations have been enlarged on PRIM! You can also view maps and custom views in full screen by clicking the Expand button at the bottom right of the data visualization. When you are in full screen, you can make the filters appear or disappear directly on the map by clicking on the Filters button.

We remain available on the Slack of the "PRIM community" as well as at the email address: [email protected] to answer your questions and welcome your suggestions.